Non Parametric Analysis of Coronavirus and Other Disease Data Sets
How can we find the stage of virus development cycle for every country without adopting any kind of model.

1. Why do we need a non parametric approach?
There are many internet sources for data about SARS-CoV-2 or simply “coronavirus” and there exist many online plots showing its worldwide spread and time evolution.
However most of the analyses use linear regression models for estimating several parameters that we need for answering critical questions about the future. Those methods suffer from many problems:
- linear regression needs many requirements to be satisfied and in most of the cases they are not fulfilled
- a model has to be assumed based on empirical past research, but nobody guarantees that it will be proper for our new case
- even if the coefficients of the regression are statistically significant, the resulted values could be under or over estimated
So, if we wish to make reliable estimations, then we need non parametric methods that will work by using only the available data points without assuming any kind of underlying model.
Such methods exist and are the Extremum Surface or Distance Estimator (ESE or EDE) plus their iterative versions BESE & BEDE respectively, if we seek for the inflection point of a planar noisy curve, see next articles: 1, 2. If we need the “elbow” or “knee” point of a curve, then we can use the UIK method, see article. Other available methods can be found here and can be used for finding roots, extremes and inflection points of every curve, with or without noise.
2. Searching for an inflection point in cumulative cases
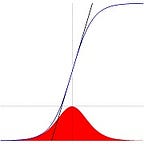
If we plot the daily total confirmed cases from China and for World we obtain next Fig.1:

By using method ESE we find an inflection point for China at Feb-05, while World is in its increasing part of the relevant cumulative developing curve, or simply said its “sigmoid” or S-shaped curve. The seemingly inflection at Feb-12 is just an artifact due to the change of counting cases in China then.
Such a strange behavior is not present in South Korea where data was collected by using the same procedure during the first cycle of SARS-CoV-2 infection, look next Fig.2:

Could we infer from the above graph that South Korea has finished from SARS-CoV-2? Certainly not, since the upper part of its sigmoid curve is not horizontal. Notice also that sigmoid curve of deaths (red) is not yet in its horizontal phase. I we focus on the part of curves after the UIK for confirmed cases, then we find Fig. 3 where it is better shown the overall completion.

Can we find a country or province for which we can argue that they have finished? Yes, Hubei province of China has finished, at least for the current phase, look Fig.4. There exist three inflection points, one for the confirmed cases (Feb-06), another for deaths (Feb-12) and a last one for recovered (Mar-03).
The interesting spot here is next fact:
- The mode of cumulative deaths curve comes after 6 days from the mode of the cumulative confirmed cases
That is an estimation for the incubation period of SARS-CoV-2 and it can be found in literature, see for example next article which reports a median time of 5.1 days, close to our finding.

Could we state such an argument for Italy? It seems that such an inflection point exists for confirmed and recovered cases at Mar-23, see Fig. 5, while for deaths the answer is still negative. We have also marked the “elbow” or “knee” point for both curves which is approximately on Mar-12 as it was computed by using the UIK method.
That is a hopeful message for Italy, since we have reasons to accept that approximately a big part of the current virus cycle of infection has been completed. The estimated number of confirmed cases is ~64K, so if we make the assumption of a symmetric curve, then we may expect that the cycle will have been completed after an amount of cases of the same order.
Of course that is not certain because Italy’s sigmoid could be non symmetric around its inflection point, just like Hubei’ s one (see previous Fig.4.), so difficult state is expected to last at least three more weeks.

3. The spatial spread of virus
What can we say about the spread of virus outside the Hubei Province from China to the rest of World? Well, we must focus on the Wuhan Airport and check the direct connections with other airports. If we do such an analysis simultaneously with the new confirmed cases for China, then we have next Fig.6:

It is evident that all cities with a direct connection to Wuhan had infected from the first days of virus spread records, so we must agree with the NY Times and their article which explained the spread process. If we look up the new countries which entered the list of affected ones, then we’ll find Fig. 7 for the number of daily new confirmed cases:

4. Main key questions
After that small parenthesis we return to our main task, that of a non parametric data analysis for the virus. The main questions are always next:
- When will the inflection point occur?
- When will the overall sigmoid curve will be completed?
As for the first answer we can always find a preliminary estimation by using the method ESE which always work if such a point exist, despite the non symmetric nature of the overall cumulative curve. If we study Hubei/China, since it has completed its cycle, then we can show the finding of inflection point from an earlier state, let’s say after 33 days from begin of data recording, see Fig. 8 and compare it with Fig. 4.

The inflection point for the confirmed cases was computed to be at Feb-08 while after including one month data the change was just two days, so we could had estimated that point only after a month of the entire process. As for the deaths, there was a different estimation (Feb-17) from the early data set. Thus we are able to find the sign of completion quite early.
5. The US Influenza Positive Tests for 2019–2020 Season
That is not a random fact but is always present when we make a cumulative study. Take for example the 2019–2020 flu data set, if we compute the inflection point of the cumulative positively found tested persons, then we have Fig. 9.
Although there exist two modes in the curve of weekly reported positive cases, if we study the cumulative curve we can find only one inflection point around 10-Feb-2020 by using ESE method.

6. The US e-cigarette vaping lung injury (EVALI) 2019–2020
A perfect sigmoid curve was found for the data set of lung injury associated with e-cigarette use, or vaping (EVALI) for United States, March 31, 2019–February 15, 2020, see Fig. 10. The relevant inflection point for cumulative cases was found by ESE method at 21-Sep-2019.

7. The difficult case of United States in SARS-CoV-2
If we plot the cumulative cases of confirmed, recovered and deaths for US then we have Fig. 9:

The curve of recovered cases is just absent, while both confirmed and deaths have a UIK point somewhere around Mar-19 and they are climbing exponentially now. That is not a good sign for the estimation of maximum number of confirmed or other cases there. The only worth doing work here is to focus at the time interval after “knee” point of confirmed cases (Mar-16) and study the curve, see Fig. 10. (The recovered cases are less than 1K, thus not shown here). It is clearly in an exponential increasing phase with no index of turning point.

That is not a good sign for US, again, because even for Italy the relevant curve after confirmed cases UIK point was almost linear, see Fig 11:

8. Conclusion
We are able to find answers to the next key questions:
- Given the data till now, can we estimate the phase of growth cycle?
- Does an inflection point occurs for our country?
- If we have reached that inflection, then how long do we need to wait?
We found that Italy has to wait approximately three weeks, while US is far away from reaching its inflection point.
A more detailed study will be done for the special case of US and for other countries of interest.