Estimations for the Expected Losses and the Ending Time of Current COVID-19 Cycle for United States
Read when the disease will get over and how many deaths are expected in US

The rational under estimations
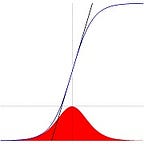
We must emphasize that every progress which has finally a cumulative output, whatever it is that, say the total length of US railways, follows a sigmoid pattern, the plot of it versus time is an S-shaped curve, see Fig. 1 where we have plotted the rate of change and the total.

Mathematically speaking the red curve in Fig. 1 is the time derivative of the blue one and if we stay on the daily COVID-19 data sets, then the red curve(“bell”) will be the daily added while the blue curve(“sigmoid”) will be the total cumulative until time of consideration. Thew inflection point of the sigmoid is the maximum point of the bell.
The above S-function is a typical Gompertz sigmoid which is used to describe typically mortality issues and is highly non symmetric. Observe that the 36.8% of the finally capacity is reached at a point which is approximately the one third of the total elapsed time. Actually we can prove that if the final outcome is L and the inflection point yi occurs when time is ti, then it holds L=e yi =2.7182 yi or approximately L ~ 3 yi. The interesting point is that time also follows approximately the same law, so if until reaching the inflection point we need time ti, then the remaining time for completing the cycle will be ~ e ti. For example in the above plot we have ti = 2, yi = 36.8 thus we have L = 100 = e 36.8 and when t = ti+e ti = 7.4 then f(7.4) = 99.5 ~ 100.
Application
What do we find if we apply the above procedure for the total deaths in US from COVID-19 til now? See Fig. 2 for the answer.

Why did we choose the date 26-Mar for the beginning? Because that date correspond to the UIK point of the entire confirmed cases curve from the 22-Jan start. Since UIK point can give the point when the curve begins its exponential phase, that is an objective choice for the study of the main cycle.
Then we used BESE method for obtaining the inflection point of the sigmoid curve and after two iterations we found it to be on 16-Apr while the relevant number of losses was 34827. So if we apply our estimation procedure then:
- expected losses (ESE) will be approximately = e 34827 = 94670
- expected time (ESE) → 12-June
If we use BEDE method then we see that we are able to apply only one iteration, so the sigmoid curve has not been completed in a way that we can use the iterative version of EDE method, see Fig. 3.

Now the inflection point is found to be later, on 22-Apr and our estimations are:
- expected losses (EDE) will be approximately = e 47412 = 128879
- expected time (EDE) → 04-July
Bad news is that the above S-curve does not seem so “S”, thus completing current US cycle will last long time.
Can we validate our results by using the “bell” curve of daily new losses here? Yes we can, see Fig. 4 for details.

Here there are a few new things. First of all we have computed and plotted the LOWESS curve of daily deaths. Then we used the Integration Extreme Finding Estimator (IEFE) on the above smooth curve and we found its maximum to be at 18-Apr, close to the previously points found before. That is also the inflection point for the relevant cumulative curve of losses. So a rough estimation would be = e 39753 =108060, again close to the previously found estimations, while the time of expected end would be 21-June.
But what if we suppose a linear time evolution for the LOWESS curve after current date? Then we have the gray line to the end of time and we can add the area of the underlying orthogonal triangle to the currently existing losses. That will give us next estimations:
- expected end time (IEFE) = 21-June-2020
- expected losses (IEFE)= 110199
Summary
So given the above estimations done we can summarize the situation for US as next:
- The current COVID-19 cycle for US will last until 26-June-2020 or 04-July-2020, based on the method used
- The expected total losses will be approximately between 95k and 129K