COVID in Greece
One success and one failure during the same year

The coronavirus in the first phase had few cases and losses, while its geographical spread was not wide. The severe lockdown imposed in March 2020 led to the temporary end of the epidemic in the country. But the opening of the tourism market for all countries began to bring steadily more than 23 imported cases per day. The situation worsened with the arrival of farm workers first to harvest peaches in Northern Greece and later olives in the South. The existence of an active student population of over 120 thousand people in the city of Thessaloniki, along with the relaxation of precautionary measures, due to fatigue but also due to the flourishing of conspiracy theories, led to a rapid rise in daily cases there. A second lockdown ensues, but this time the virus has spread throughout the territory and the deaths are now high. The nationwide lock remains to be seen whether it will lead to a short completion of the second phase or whether it will follow an independent course.
First phase
The first confirmed cases were on February 26, 2020 while the first death was recorded on March 11, 2020. The sigmoidal cumulative growth curve of the confirmed cases had an inflection point (EDE method, [1.], [2.]) on April 1 and was “flattened” reaching the maximum of the first cycle at the end of May, see Fig. 1 while the sections I-IV are defined at [4.]

The corresponding sigmoid curve of the losses had an inflection point 8 days later, but it took almost a month to be “flattened”, see Fig. 2.

This is a confirmed feature of coronavirus, i.e. the lag between the peak of cases and losses, observable in all countries.
The first wave was not particularly intense mainly because there was no tourist flow to Greece in March. The main infectious sources came from a trip to the Holy Land and the MIFUR exhibition Feb. 20–23 / 2020 in Milan. Nevertheless, a hard lockdown was decided from March 23rd to May 4th, which managed to practically eliminate the cases. Of course, the “hardness” of the lock also had some negative social effects, as was seen in the following months.
The lack of spread of coronavirus cases throughout the country created in many people the feeling of its “non-existence”, many Greeks wondered, privately or publicly,
How much coronavirus is out there finally?
The answer was unfortunately given seven months later, when the death toll exceeded 100 per day. The strict policy of March led to unreasonable fatigue of the population with consequent excessive relaxation when the cases objectively increased in the summer due to tourism. To put it another way, using a folk tale,
Because the “shepherd” kept shouting “wolf, wolf” without actually existing, when finally the “wolf — coronavirus” came, then no one heard the voices of the “shepherd”.
Much has been said about the famous active reproduction number Rt, but no chart has been publicly released by the official authorities. See in Fig. 3 its evolution until the end of the first wave (computation using [3.]) where it is clear that the epidemic had already been controlled before Easter and also no adverse change occurred with the gradual opening of the economy.

So it is obvious that if there is no virus in the community and if there are no imported cases, then we do not have the spread, whatever the behavior of the public.
The communication extremities that was presented on TV by the “experts” probably had to do with their need for personal publicity and not with informing and raising public awareness.
Summer break
After the disappearance of any internal source of transmission of the virus, the country finally fully opened its borders with abroad, to open the coveted tourism, the so-called “locomotive of the Greek economy” (the one that succeeded the construction sector of earlier times). Initially there were proposals for a strict opening with entry only for those who show a negative COVID-19 test, but this was quickly abandoned due to an unknown other algorithm for selecting a sample of tourists to check, called “EVA”. Given that the coronavirus was rampant all over the world, and given that the second wave had already begun in the Balkans, this choice was probably extremely misguided in the light of maintaining public health.
See in Fig. 4 how the death toll began to rise again after the borders were opened.

while in Fig. 5 you can confirm that the transmission index was high at the same time period.

Perhaps if there had been a strong financial subsidy for domestic tourism exclusively to Greeks, without opening the borders, then we would not have had the health disaster of November, and revenues would not have dropped dramatically, as Greek tourists are extremely consuming in their vacation.
Given that the large tour package company TUI is not going to repay hoteliers before March 2021, it is clear that any financial benefit from the capital inflow becomes marginal compared to the health damage that has occurred.
Another big issue is the control of COVID-19 for the thousands of farm workers who came to the prefectures of Pella and Imathia initially as well as to other prefectures later, for harvest in the orchards. There have been allegations for circulation of false-negative tests which led to the closure of the Krystallopigi border crossing in November.
Refusal
Of course we have to mention the refusal of the Greek society to admit that: (a) the coronavirus exists, (b) it is extremely deadly and (c) measures are needed to limit its transmission. There are several denial categories and they can be summarized as follows:
- The total negatives of the coronavirus: “the virus does not exist and everything is a global conspiracy to control the world’s population”
- The risk degraders: “there is a virus but it is just another flu and the dead are also overestimated”
- The negatives of closure: “lockdowns are of no use and are simply made to vent the economy, to impoverish the population financially, always with the ultimate goal of controlling it”
- The negatives of the usefulness of the mask: “the mask does not block the transmission of the virus, but causes various damages due to the low oxygenation caused by its use”
- Those who consider the mask a means of enslavement: “the mask is used to humiliate the public by hiding the face in order to turn it into a homogeneous social porridge”
- The followers of the social experiment: “the virus was deliberately dropped in Thessaloniki to study the reaction of the population, in order to design more effective ways of control in the future”
- The fans of the Swedish model: “we do not need to do anything since Sweden is doing just fine!”
We will not analyze each category of denial separately because this would require the writing of one article per case, but we must emphasize that all together contributed to the general relaxation and non-compliance with basic precautions, especially in workplaces and entertainment, resulting in a series of cases in various parts of the country in summer and autumn.
Second phase
The second phase with respect to the dead is presented in relief in Fig. 6, where the total loss curve appears to rise without any sign of bending.

It is obvious that now there is a wave of coronavirus in Greece, while the adventure of March seems extremely mild. At this stage the transmission index is erratically above 1, see Fig. 7.

The number of weekly tests per 100K inhabitants has increased well above the limit of 300 set by the ECDC to include a country on its maps while the corresponding positivity index is also well above the 4% which is the “red limit”, see time evolution in Fig. 8.

An other indicator widely used by the ECDC to rate countries is the total number of confirmed cases (or victims) in the last 14 days per 100K population. If we make this simple analysis for Greece we see in Fig. 9 that the second wave is extremely stronger than the first and we also notice that there is a very short time lag between the case-dead curves, just one week. This shows that when the most vulnerable sections of the population are affected (high risk groups, people with underlying diseases) then the possible negative outcome is extremely short.

The most worrying indicator is that of the new admissions to the ICU per week and 100K which is increasing exponentially, see Fig. 10, from where it seems that the Greek health system reached its limits in November 2020.

Assessment based on the history of similar countries
In order to assess the course from now on, we must study other countries, similar to Greece, both in population and in wider characteristics, geographically, economically and behaviorally. One such country is Israel, since it has a similar population (8519373), is located in the Mediterranean, has a similar climate and inhabitants with the same western way of thinking as the Greeks. The first phase found Israel with a relatively small total number of casualties (285 at the end of May 2020), there was a period of summer relaxation and then the death toll began to rise considerably around July 13th. The country was forced to make a second lockdown on October 18 and now seemed to had completed the second phase, see Fig. 11 showing the inflection point of the second cycle at Oct. 7th, but now the curve of losses seems to rise up again.

If you compare the Figures 6 & 11 of the second phases for Greece and Israel, you will see that there are several similarities:
- the two countries had completed the first cycle rather successfully with relatively few losses
- there was a summer relaxation with a small but significant increase in deaths
- the situation at some point “escaped” and led to a second lockdown.
For the moment lockdown in Greece seems not be so successful as it was in Israel.
Of course there are other differences between the two countries, for example Israel actually seems to be now in the third wave if we take into account the criterion of cumulative cases — victims per 100K in the last 14 days, see Fig. 12

and compare it with the corresponding Fig. 9 of Greece, from which it appears that: (a) Israel exceeded the “red limit of 150” of the ECDC on 7/11 and had a second peak of cases at the end of July (b) the third peak occurred one week before the second closing. There is also a similarity in time between the peak of the curves (cases or losses) that are 8 days as in Greece.
Another country that bears a striking resemblance to Greece is Croatia, which although has about half the population of Greece, has in absolute numbers corresponding losses while the start and peak dates of the cycles are identical so far, see Fig. 13.

The coincidence is not coincidental, as both countries share the same sources of tourist input as having a similar tourism product. Of course, at the moment Croatia has not implemented a strict lockdown, so the comparison between the two countries can not continue.
Discussion
From the presentation of the time evolution of various quantities related to the coronavirus, it appears that in the first phase we had some sporadic cases that can not be characterized as an epidemic, in the summer tourism did not open with strict safety valves, also land workers entered virtually uncontrolled and finally there was widespread denial arguments of the virus as well as conspiracy theories throughout the territory and especially in the area of Thessaloniki. As a result of the denial but also the fatigue from the March hyper-campaign, there was a relaxation and we reached over 100 daily losses in November and December.
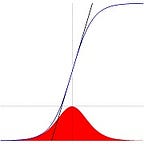
Estimates of the expected number of cases and losses from the coronavirus are based on the so-called epidemiological models, which adopt a specific way to quantify the process from virus infection to any outcome, recovery or death. But experience so far has shown that they have not been successful at all because they either overestimated or underestimated the evolution of the phenomenon. The causes of this failure are analyzed in a relevant article [4.] where a new approach is presented, based on the simple observation of the simultaneous existence of an inflection point in the cumulative curve (“sigmoid”) when the maximum appears in the daily event curve (“bell”), see Fig. 14.

Given the fact that coronavirus has so far shown up to three waves in some countries, such as Serbia, see Fig. 15

see also Fig. 16

we conclude that
Inflection Point Analysis is absolutely necessary for the safe assessment of both the current position in the cycle and the overall expected result at its end.
The presence of an inflection point in the overall confirmed cases or loss curves is a reliable criterion for estimates that do not presuppose the adoption of an epidemiological model.
As for Greece, second phase either will be “flattened” signaling the temporary end of epidemic or it will begin rising again, like in Israel and other countries: just a “click” before the end of a cycle, a new one starts…
References
- Demetris T. Christopoulos. “Developing methods for identifying the inflection point of a convex/concave curve”. In: arXiv.org (2012). url:http://arxiv.org/abs/1206.5478.
- Demetris T. Christopoulos. “On the Efficient Identification of an Inflection Point”. In: International Journal of Mathematics and Scientificc Computing (ISSN: 2231–5330) 6.1 (June 2016). url: https://veltech.edu.in/wp-content/uploads/2016/04/Paper-04-2016.pdf.
- Anne Cori. “EpiEstim: Estimate Time Varying Reproduction Numbers from Epidemic Curves”. R package version 2.2–3. 2020. url: https://CRAN.R-project.org/package=EpiEstim.
- Demetris T. Christopoulos. “A Novel Approach for Estimating the Final Outcome of Global Diseases Like COVID-19”. In: medRxiv (2020). doi:10.1101/2020.07.03.20145672.
Originally published at http://www.maths.gr.